Biodiversity monitoring based on field data across the entire Earth poses a significant challenge, which has been alleviated with the advent of remote sensing technology, offering new possibilities for Earth observation. Diving deeper into these possibilities, a 2022 paper supported by SHOWCASE reviewed the potential of the spectral species concept – an algorithm that clusters pixels from spectral images based on their spectral signals, offering an exciting approach to ecological monitoring.
Over the years, remote sensing has enabled the monitoring of ecological change through the analysis of variations in vegetation cover, distribution, and functioning. The spectral species concept takes this a step further by identifying "spectral species" through clustering pixels with similar spectral signals. This concept has garnered significant attention for its potential to revolutionise biodiversity monitoring. To provide further insight into the concept, the paper “The Spectral Species Concept in Living Color” reviews the ecological functioning principles of the spectral species concept and refines its definition by establishing stronger connections with field observations of plant species distribution data obtained from comprehensive vegetation surveys.
Read the full paper here.
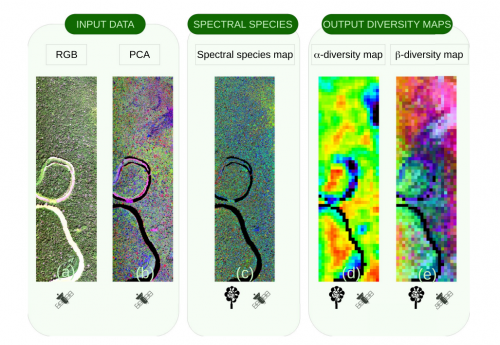
Photo: The spectral species algorithm phases. The original image was acquired with the CAO AToMS imaging spectrometer during an airborne campaign over the CICRA experimental site (Amazonian Peru) (https://www.amazonconservation.org/about/mission-vision/cicra-station/). The first image (a) corresponds to the RGB representation of an imaging spectroscopy subset. A standardized PCA is applied on (a) and a reduced set of components is selected (b) to maximize signal corresponding to biological patterns on forested areas and discard noisy components. Spectral species are defined for each pixel by applying an unsupervised k-means clustering on the spectral space defined by selected components (c). In this phase, a field survey recognition based on in situ data is crucial to define the number of singular spectral signatures (spectral species) expected. The spectral species map is divided into elementary spatial units and the spectral species inventory is performed for each spatial unit, by further calculating Shannon's H and Bray-Curtis metrics to derive (d) alpha- (ranging here from minima to maxima from black to blue, green and red) and (e) beta-diversity (in which colors represent differences among spectral species) maps, respectively.