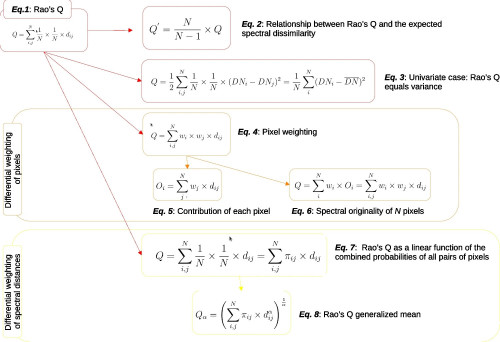
In a recent co-funded SHOWCASE study, researchers Duccio Rocchini (University of Bologna), Michele Torresani (University of Bolzano) - SHOWCASE partners - and Carlo Ricotta (University of Rome), have explored the importance of spatio-ecological heterogeneity in ecosystems and presented a compelling case for using the Rao’s Q index as an advanced method to measure this heterogeneity through remote sensing. Their paper underscores how remote sensing can reveal critical insights into ecosystem properties like species distribution and habitat structure by providing comprehensive spatial data.
The authors argue that traditional metrics like variance, though commonly used, fall short in capturing the multi-dimensional nature of landscape diversity. Rao’s Q index, which incorporates both species abundance and spectral distances between pixel values, addresses this gap by offering a more robust analysis tool. This index measures spatial heterogeneity with a unique approach: it integrates diverse ecological data types and accommodates complex variables by accounting for both categorical differences and their relative proportions within an ecosystem.
Key features of Rao’s Q highlighted in the study include its flexibility to operate within multivariate spaces, its ability to apply differential weighting to pixel values and its capacity to account for the spectral distance between these values. These features make Rao’s Q a powerful tool for ecological studies that use remote sensing data, allowing for a more detailed analysis of biodiversity patterns. Compared to traditional measures, Rao’s Q provides a multi-layered understanding of spatial diversity by integrating spatial, spectral and categorical data into a single, unified framework.
The authors emphasise the value of this approach in identifying "hidden" regions within the diversity spectrum, which are often overlooked by simpler point-based methods. Their findings advocate for a generalised version of Rao’s Q index, which, by extending beyond basic abundance and spectral measures, offers ecologists and conservationists a more nuanced tool to understand and manage biodiversity.
This paper is a significant contribution to ecology and remote sensing, illustrating the potential of Rao’s Q index as an advanced measure for analysing complex ecosystem structures and enhancing the study of biodiversity through remote sensing technologies.
Read the full study here.
Image: Flowchart of the main formulas described in this paper describing the Rao’s Q index formula (Eq. 1) and its main properties (Eq. 2 and 3). Starting from the Rao’s Q index, pixels can be differentially weighted (Eq. 4) to give more importance to specific landscape characteristics, with the possibility of calculating the contribution of each pixel (Eq. 5) as well as the spectral originality (sensu Ricotta et al. 2016) of N pixels (Eq. 6). Furthermore, one can assign a differential weight to distances, e.g., to larger distances which account for the highest possible turnover (Eqs. 7 and 8)
