A SHOWCASE-funded paper “Measuring diversity from space: a global view of the free and open source rasterdiv R package under a coding perspective” presents a new R package - rasterdiv - to calculate diversity indices based on remotely sensed data, by discussing the theory behind the developed algorithms.
Ecology has recognised the variation of species diversity over space and time as one of its key challenges. The measuring of such diversity is difficult for a set of logistic reasons relating to time and costs for sampling. Additionally, there are some theoretical and practical constraints such as the uncertainty associated with the detectability and the determination of individual plant or animal species and the different sampling strategies employed per area.
In this context, algorithms based on remote sensing and spatial ecology present themselves as an opportunity to help redeem these shortcomings. Among the different free and open source algorithm packages, the R software is one of the most widespread worldwide and different packages have been devoted to remote sensing, for example, for remote sensing data analysis or landscape metrics calculation. However, no package provided a flow of functions grounded on Information Theory related to abundance-based measures, by further introducing distances and going back to Information Theory again by generalised entropy.
This SHOWCASE paper published in Community Ecology volume 22 introduces a new R package that does just that. Find out more about the new R package - rasterdiv here.
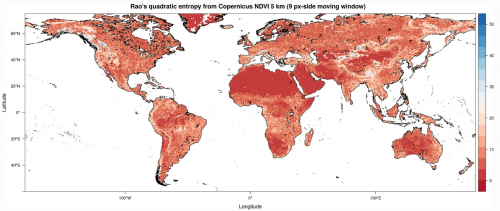
Photo: Rao’s Q index calculated on a Copernicus Proba-V NDVI image at 5 km. Differently from the original Shannon’s formula, Rao’s Q also considers the distance among different values by better discriminating the queues of the diversity distribution from very low diversity (e.g. deserts and ice fields) to very high diversity (e.g. upper highly complex mountain ranges). This figure has been generated by the command Rao(ndvi17_r,dist_m=“euclidean”,window=9,np=8, cluster.type=“SOCK”,na.tolerance=0.5).