A study, conducted by Czech University of Life Sciences Prague, University of South Bohemia, Swiss National Park, University of Tartu, University of Sassari and SHOWCASE partners, Free University of Bolzano-Bozen and Alma Mater Studiorum University of Bologna, investigates how flowering affects the applicability of six different remotely sensed spectral diversity (SD) metrics, focusing on the confounding effect of flowering in this type of analysis. Using UAV multispectral data in Czech mesic grasslands, it assesses six SD metrics and their applicability for monitoring plant species richness at local scales. By considering factors like flowering, bare soil, shadows and spatial resolution, it aims to refine SD-based approaches for efficient, scalable biodiversity monitoring in complex grassland ecosystems.
This study uses vegetation data from 159 plots in a Czech permanent grassland experiment through multispectral UAV imagery to evaluate six spectral diversity (SD) metrics for monitoring plant species richness (SR). Statistical analysis applied to explore the effects of flowering and community type on SD provided insights into the applicability of different metrics for grassland biodiversity monitoring.
The study found significant differences in reflectance values between plots with and without flowering across all six spectral bands, indicating that flowering affects both visible and near-infrared regions of the spectrum. Significant spectral differences were observed between flowering and non-flowering plots, especially in Green, Red and NIR bands, with flowering influencing continuous SD metrics due to extreme reflectance values.
A positive relationship between spectral diversity (SD) and species richness (SR) was observed only when SD was measured using categorical metrics, while continuous metrics showed flowering as the only significant variable associated with SD. The models based on categorical metrics explained a small portion of variability in spectral heterogeneity, suggesting the influence of additional confounding factors, which pose a challenge to analysis deriving from confounding factors (e.g. phenology, biomass, vertical structure).
The study also emphasises the importance of spatial resolution and timing in optimising SD metrics for biodiversity monitoring, outlining the need to optimise these factors.
Read the full study here.
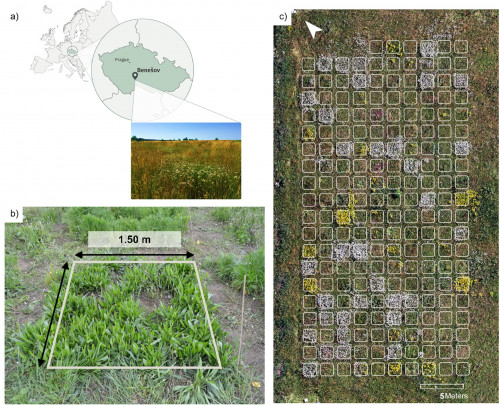
Image: Fig. 1. (a) Location of the study area. (b) Example of a 1.5 m × 1.5 m surveyed plot. (c) Natural-colour mosaic of the whole study area.