Biodiversity continues to decline despite past conservation efforts, prompting new policies like the EU Biodiversity Strategy, which require national ecosystem condition mapping. However, such mapping, especially for croplands, relies heavily on proxy indicators due to a lack of primary biodiversity data, raising concerns about accuracy. To address these gaps, a joint SHOWCASE and SELINA-supported study, authored by partner HUN-REN Centre for Ecological Research, tests how well a pressure-based cropland condition map reflects actual biodiversity using farmland bird data, while also examining the relevance of applied thresholds, key proxy variables and spatial variation in these relationships.
The paper used two main datasets for Hungary: a cropland condition map (based on proxy indicators like land use and management from subsidy claims data) and a biodiversity-based map (using relative richness of characteristic farmland bird species from volunteer bird counts). To validate the proxy-based map, researchers aggregated data to a common 2.5 km grid, corrected for observation effort and habitat composition and used residual relative bird richness (rRRCS) as an indicator of ecological quality. They then tested how well the cropland condition and its components predicted rRRCS using statistical models, including Tukey tests and Random Forest regressions, examining both overall predictive power and local variable importance.
The results show that most condition indicators and their categories correlate well with bird-based biodiversity (rRRCS), with higher condition scores generally reflecting better ecological quality, though some extreme categories showed inconsistent trends. The proxy-based map was simplified accordingly to improve clarity. Among individual variables, the proportion of semi-natural areas and High Nature Value Area subsidies were the strongest predictors of rRRCS. Random Forest models explained a large portion of the rRRCS variance (median R² = 0.81), performing best in central and eastern Hungary and less effectively in the west.
The discussion highlights that the MAES-HU cropland condition indicator effectively reflects farmland bird presence, validating its use as a proxy for biodiversity where direct monitoring is scarce. The selected pressure-based variables, especially the proportion of semi-natural areas and High Nature Value Area subsidies, were shown to be meaningful predictors, though their influence varies regionally. While certain variables like parcel size were less informative, overall, the indicator reliably captures biodiversity patterns, particularly in Hungary's central and eastern regions.
Hence, the study underscores the spatial variability in model performance and suggests refining variable selection, thresholds and simplification methods to improve usability and communication of condition maps. This is important because it demonstrates that pressure-based proxies can effectively map cropland condition and biodiversity patterns at large scales, offering a practical tool for conservation planning in data-scarce regions. Additionally, it recommends incorporating better-quality datasets (e.g., pesticide use, field margins) in the future and cautions against applying uniform models in ecologically diverse landscapes, emphasising the importance of balancing mapping simplicity with ecological accuracy for effective conservation planning.
Read the full paper here.
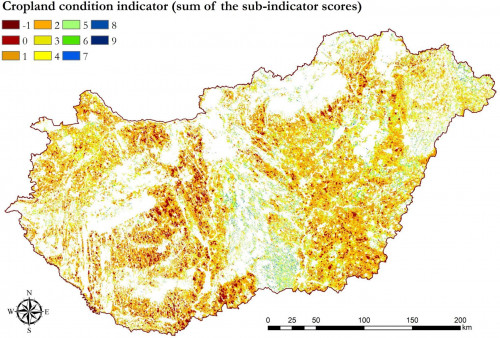
Image: Fig. 2. The map of the MAES-HU pressure-based cropland condition indicator for Hungary (the sum of scores − Tanács et al. 2022). Higher values mean a favourable state for maintaining and supporting biodiversity. The white colour indicates non-cropland areas.